Why is my Meta CPA going up when nothing changed on the ads or the site?
Written from hands-on work in: Shopify conversion rate optimization, Landing pages and advertorials, A/B testing, Checkout and subscription offers, Supplement DTC funnels.
Short answer
Something did change, just not something you touched. CPA is cost per session divided by conversion rate, and cost per session is CPM divided by sessions per impression. Split the rise across those three numbers and it lands on one of five causes: a pricier auction, a saturated audience, budget drifting to costlier campaigns, weaker clicks, or different buyers reaching an unchanged site.
Key takeaways
- "Nothing changed" usually means nothing you changed. The auction, the audience, the budget split, the click and the buyer all move without anyone logging in.
- CPA is cost per session ÷ conversion rate. Split every rise into those two before anyone argues about the cause.
- Meta's average price per ad rose 12% year over year in Q2 2026, so the same ad gets more expensive even when you leave it alone.
- If spend goes up while reach goes down, you are paying more to show the same ads to the same people.
- Before changing anything, check that Meta did not change how it counts. It stopped returning 7-day and 28-day view attribution in its Ads Insights API on January 12, 2026.
Did nothing really change?
You open Ads Manager on a Monday. The same ads that carried the spring are still running. The product page has not been touched in months. The offer is the same. And CPA is up a third since summer.
Your agency says seasonality. Your gut says somebody broke something. The usual next move is one of three reflexes: refresh the creative, cut the budget, or redesign the page. Each one can make things worse if it treats the wrong cause.
Here is the uncomfortable part. The ads and the site are only two of the seven things that set your CPA. The other five move on their own: the price of the auction, the pool of people Meta can still show you to, the way budget spreads across campaigns, the share of clicks that become real visits, and who is on the other end of those visits. On top of all seven sits the way Meta counts purchases, which can move your reported CPA when nothing real moved at all.
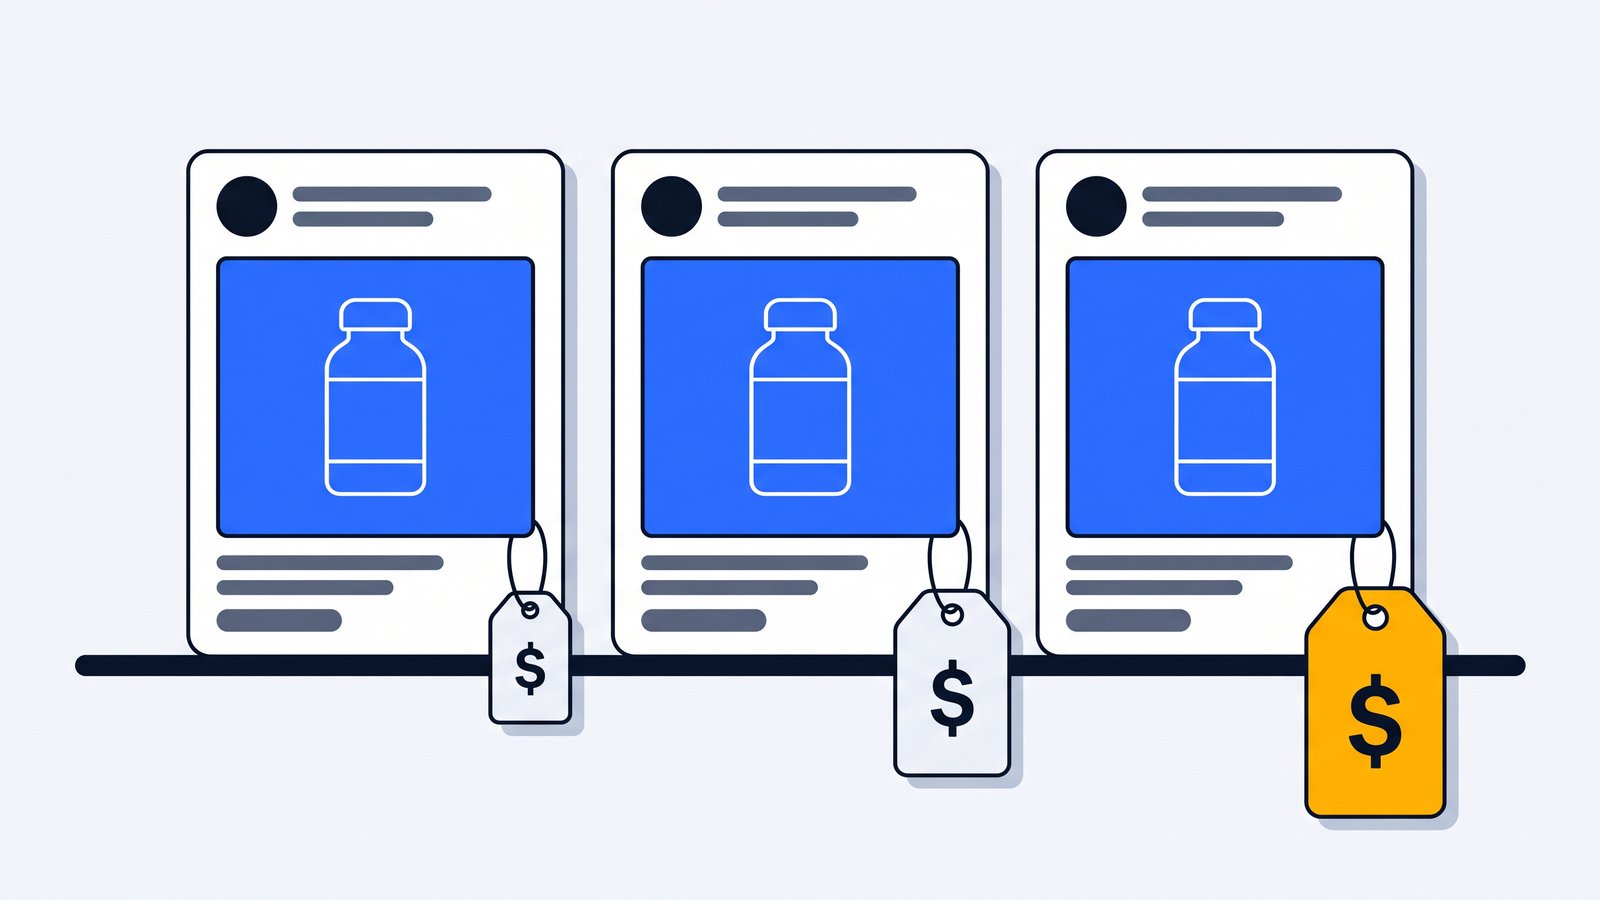
So "nothing changed" is almost never true. What is true is that nothing you changed. That is good news, because the other things are measurable. You do not need an opinion about them. You need three numbers.
What is Meta CPA actually made of?
CPA, or cost per acquisition, is what you pay Meta for each order. Ads Manager shows it as cost per purchase or cost per result, and it works the same way for Facebook and Instagram ads. It looks like one number. It is really a chain of three, and every rise lives in one link of that chain.
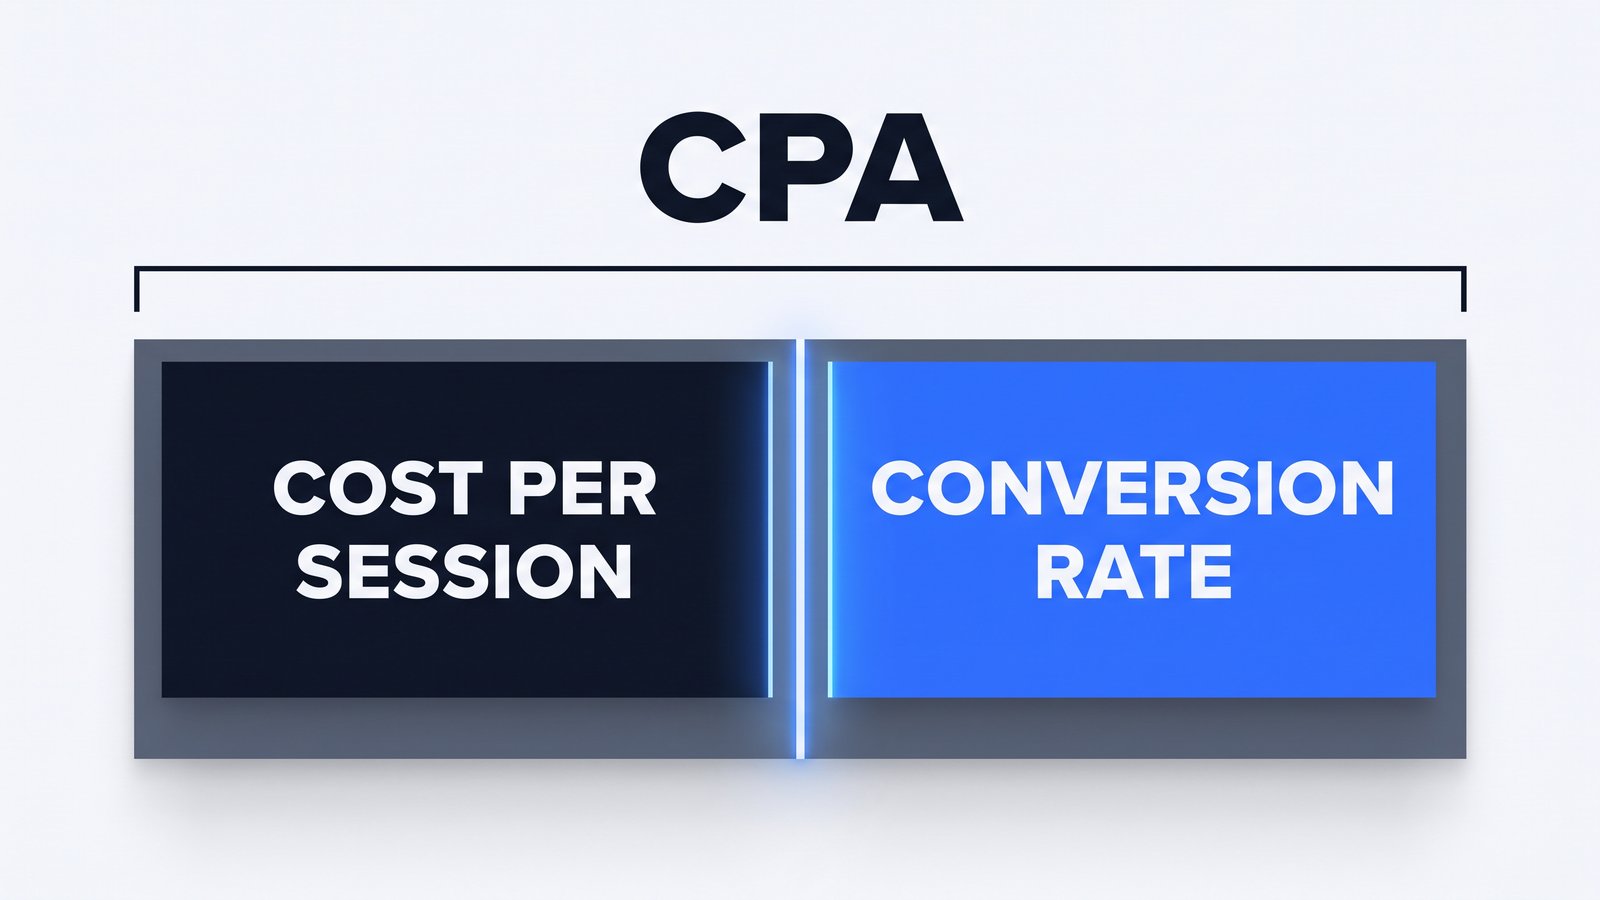
Watch what one link does on its own. In the example below, the ad, the page and the conversion rate are identical in both months. Only the auction price moved.
| Number | Month 1 | Month 3 | Change |
|---|---|---|---|
| CPM | $20.00 | $26.00 | +30% |
| Sessions per 1,000 impressions | 12 | 12 | flat |
| Cost per session | $1.67 | $2.17 | +30% |
| Conversion rate | 2.0% | 2.0% | flat |
| CPA | $83 | $108 | +30% |
A 30% jump in CPA, and not one pixel of the ad or the site changed. If someone had redesigned the product page in month two, the page would have taken the blame for a rise it had nothing to do with.
Where to get the numbers: CPM and impressions from Ads Manager, sessions and orders from Shopify for Meta traffic (filtered by your UTM source), both by week for the last 60 to 90 days. Use Shopify for sessions and orders even though it will not match Meta exactly. You want the business's truth on the bottom of the chain, not the platform's.
Which number moved, and what does it mean?
Once the three numbers sit side by side by week, the cause usually names itself. This is the lookup we use:
| What you see | Likely cause | Where to check |
|---|---|---|
| CPM up across most campaigns, frequency and CTR flat | The auction got pricier | CPM by week, same weeks last year |
| CPM and frequency up, reach down, CTR slipping | Audience saturated | Reach vs spend by week, frequency and CTR by ad |
| Each campaign steady, account CPA up | Budget drifted | Spend share by campaign, week by week |
| CTR flat, fewer sessions per 1,000 impressions | Click quality fell | Placements, link clicks vs landing page views vs Shopify sessions |
| Cost per session flat, conversion rate down | Different buyers or a changed offer | Conversion by campaign, new vs returning, promo and stock calendar |
| Meta CPA up, Shopify cost per order flat | Meta changed how it counts | Attribution setting, Meta purchases vs Shopify orders |
Five of those rows are real costs. The last one only exists in the report. Check it first, because it is the cheapest to rule out and the most expensive to miss.
First, rule out the fake cause: did Meta change how it counts?
Sometimes CPA goes up in Ads Manager while the business is fine. Meta is not reporting fewer sales because fewer people bought. It is reporting fewer sales because it counts fewer of them.
The clearest recent example: on January 12, 2026, Meta stopped returning the 7-day view and 28-day view attribution windows in its Ads Insights API. The 1-day click, 7-day click, 28-day click, 1-day engaged view and 1-day view windows remained (Meta for Developers). Any dashboard or report built on the longer view windows lost those view-through purchases overnight, and CPA rose with them.
The other version of this is a broken signal. A theme update, a new app or a checkout change can quietly stop purchase events from reaching Meta. Reported purchases fall, reported CPA rises, and because Meta now optimizes on thinner data, delivery can genuinely get worse. That is how a fake cause turns into a real one.
Cause 1: the auction got more expensive
You do not buy ads at a fixed price. You bid against every other advertiser chasing the same people, and when they spend more, you pay more for the same impression.
Meta's own numbers show the drift. In Q2 2026, ad impressions across its apps rose 14% year over year, and the average price per ad still rose 12% (Meta). More supply and a higher price at the same time means demand grew faster. Flat creative gets more expensive every quarter without anyone touching it.
Then there is the calendar. From October, every retailer with a holiday budget joins the auction you were already in. That is why a month-over-month comparison lies in the fall. Compare to the same weeks last year instead.
How to tell it is price
- CPM rose across most campaigns at the same time, not in one.
- Frequency held steady, so you are not simply hitting the same people harder.
- CTR and sessions per 1,000 impressions held, so the ads still pull the way they did.
What to do: do not kill ads that still convert just because the market got pricier. Price is the one cause you cannot fix, only outgrow. The levers are creative that earns cheaper delivery and a conversion rate strong enough to absorb the price. If your margin cannot absorb it, that is an offer and unit economics conversation, not a media one.
Cause 2: you are paying more to reach the same people
This one hides best, because nothing looks broken. Spend goes up. Impressions go up. But reach, the number of different people who saw your ads, goes down. Frequency climbs, CTR slips, and CPM creeps up as Meta works harder to find anyone new who fits.
In plain terms: your ads have already been shown to most of the people they appeal to. Meta keeps serving them to the same crowd because that crowd is the only one your creative has earned.

Meta's delivery system matches ads to people at huge scale. Its retrieval engine, Andromeda, was built to handle the growth in the number of ads and pick which ones each person sees (Engineering at Meta). The practical takeaway: an account whose ads all make the same argument to the same kind of buyer gives that system very little to work with. Twenty edits of one ad look like one ad to someone who has already scrolled past it.
How to tell it is saturation
- Weekly spend is up while weekly reach is flat or down.
- Frequency on your top ads is climbing week after week.
- CTR on the same ads is sliding, and the newest ads are variations, not new ideas.
What to do: new angles, not new headlines. A different problem, a different buyer, a different format, a different face. Our guide on how many creatives to test covers the volume side.
Cause 3: the budget moved while nobody was watching
Your account CPA is an average, weighted by where the money goes. Change the weights and the average moves, even if every campaign performs exactly as it did before.
Here is how that looks with two campaigns that never change. Campaign A buys customers at $60. Campaign B buys them at $120. Split $10,000 evenly and the account CPA is $80. Shift the split to one quarter A and three quarters B, and the account CPA is $96. That is a 20% rise, and neither campaign got one cent worse. (Illustrative numbers.)
Drift like this rarely comes from a decision. It comes from automation moving budget toward what it predicts will convert, a new campaign being scaled while the old one is left alone, or a retargeting pool shrinking as prospecting grows. Large budget edits can also push ad sets back into Meta's learning phase, where results are less stable (Meta Business Help Center).
How to tell: put each campaign's share of spend in a table by week. If the cheapest campaigns quietly lost share and nobody remembers deciding that, you have found your cause. What to do: decide the mix on purpose, and give the cheap, proven campaigns their share back before you look for new ones.
Cause 4: the clicks got worse
A click in Ads Manager is not a visit in Shopify. Between the two sit placements, load time, redirects and accidental taps. When that gap widens, you pay for clicks that never become visits, and cost per session rises while CTR looks perfectly healthy.
- Placement mix shifted. Automated placements can move delivery toward inventory where clicks are cheap but rarely turn into real visits.
- The page got slower on mobile. A new app, a heavier image or a script added to the theme can lose visitors before the page even loads.
- Links broke or redirected. A changed URL, a redirect chain or a missing UTM can make real visits look like fewer visits.
How to tell: follow the chain by week and by placement: link clicks, then landing page views, then Shopify sessions. If Meta reports the same clicks but Shopify sees fewer visits, the leak is between the ad and the page, not in the auction.
Cause 5: the site did not change, but the visitors did
If cost per session held and conversion rate fell, the temptation is to blame the page. But an unchanged page can convert worse for two reasons that have nothing to do with the page.
The buyers got colder. As Meta reaches further out to find new people, more of your traffic is people who have never heard of you. They are aware of the problem at best. A product page built for people who already want the product will convert them worse, even though it did not change at all.
Something around the page changed. Look beyond the theme:
- A promotion or email discount ended.
- The best-selling size, flavor or bundle went out of stock.
- Shipping prices or the free-shipping threshold changed.
- An app update broke reviews, the cart or the subscription widget.
- Prices moved, on your store or on a competitor's.
How to tell: split conversion rate by campaign and by new versus returning visitors. If returning visitors convert as well as ever and new visitors got worse, the traffic changed, not the site. Then list every change outside the theme in the last 60 days. Our guide on a Shopify conversion rate drop covers the site side in detail.
Is it seasonality, or is it my agency?
Seasonality is a real cause. It is also the most common way to end a conversation without an answer. "It's seasonal" is a conclusion. It should come after the numbers, not instead of them.
A good answer to "why is CPA up?" sounds like this: "CPM on our two biggest campaigns rose about the same as last October, frequency held, conversion held, so this is price. Here is what we are doing about it." A weak answer sounds like "the algorithm is learning" for the third week in a row.
Five questions that separate the two:
- Which of CPM, sessions per 1,000 impressions and conversion rate moved, and by how much?
- How does this CPM compare to the same weeks last year?
- What happened to reach while spend went up?
- How did each campaign's share of spend change over the last eight weeks?
- Did the gap between Meta's purchases and Shopify's orders change?
If those answers come back with numbers, you have a partner who is looking. If they come back with adjectives, see our guide on agency red flags.
How we trace a rising CPA at Succession
When a founder brings us a rising CPA, we do not start with a creative refresh or a page redesign. We start with a table, and the table usually ends the argument.
- One market first. We isolate the US before anything else. Mixed international traffic drags every rate down and hides the real movement.
- Rule out measurement. Meta's purchases next to Shopify's orders from Meta traffic, by week. If the gap moved, measurement gets fixed first.
- The weekly chain. CPM, frequency, reach, sessions per 1,000 impressions, cost per session, conversion rate and CPA, per campaign and for the account, indexed to the first week so every change reads as a percentage.
- The budget mix. Each campaign's share of spend by week, so drift shows up as a line, not a hunch.
- Like with like. We compare weeks with similar spend, and the same weeks last year, so scale and season do not pass for performance.
- Name the first number that moved. Then the fix goes to the owner of that number: media, creative, page, offer or tracking.
The data pull is automated on our side. The table itself is something any founder can ask their team or agency to produce this week.
What should you do this week?
- Pull the last 90 days by week: spend, impressions, reach, frequency, CPM, link clicks, landing page views, and Shopify sessions and orders from Meta traffic.
- Compare Meta's purchases to Shopify's orders. If the gap widened, fix tracking before anything else.
- Compute cost per session and conversion rate. Decide which of the two moved.
- If cost per session moved, split it into CPM and sessions per 1,000 impressions, then check reach and budget share.
- If conversion rate moved, split it by new versus returning and list every change outside the theme.
- Change one thing, aimed at the number that moved, and write down the result you expect before you make the change.
If you would rather have someone do the split with you, our free growth audit runs this exact diagnosis on your account, live.
FAQ
Why is my Facebook ads CPA going up?
Facebook and Instagram ads both run through Meta Ads Manager, so a rising Facebook CPA has the same five causes: a pricier auction, a saturated audience, budget drifting to costlier campaigns, weaker clicks, or colder buyers reaching an unchanged site. Rule out a reporting change first, then split CPA into CPM, sessions per 1,000 impressions and conversion rate.
Why is my Meta CPM going up?
Usually for one of two reasons. The auction got more expensive (Meta's average price per ad rose 12% year over year in Q2 2026, and retail advertisers crowd in from October), or your ads saturated their audience, which shows as frequency rising and reach falling while spend grows. Flat frequency points to price. Climbing frequency points to saturation.
How much of a CPA increase is normal?
There is no universal number. Compare your CPA to the same weeks last year, and your CPM to the market: Meta's average price per ad rose 12% year over year in Q2 2026. A rise in line with the market and your own seasonality is weather. A rise well past both has a cause you can find.
Should I cut Meta spend when CPA goes up?
Not before you know which number moved. Pulling back can help when the audience is saturated, because you stop paying to reach the same people again. When the auction simply got pricier, cutting spend shrinks the business without fixing the price. Split the CPA first, then decide.
Will new creative fix a rising CPA?
Only when the cause is creative. New angles fix saturation, where frequency climbs and CTR slides. They do little for budget drift, broken tracking or a conversion drop on the site. Refreshing creative by reflex is the most common way to spend a month on the wrong fix.
Can Meta CPA rise while my real cost per customer stays flat?
Yes. If Meta counts fewer purchases, because of an attribution change or a broken pixel or Conversions API setup, reported CPA rises while real orders hold. Compare Meta's reported purchases with Shopify orders from Meta traffic each week to catch it.
How long does it take to find the cause?
With 60 to 90 days of weekly data from Ads Manager and Shopify, the split itself takes a few hours. Most of the time goes into getting clean data: one market, consistent UTMs and a clear line between Meta traffic and everything else.
When to bring in Succession Media
Succession Media is a DTC growth agency for Shopify brands doing $50K to $1M a month, strongest in supplement, wellness and health categories. This guide's topic maps to our Full-stack DTC growth work. It is worth a call if:
- You spend $30,000 or more a month on Meta and CPA is up 20% or more in the last 60 days.
- The explanation you got was "seasonality" or "the algorithm", with no numbers attached.
- Spend went up while reach went down.
- Meta's reported purchases and Shopify's orders have drifted apart.
- Nobody can tell you how each campaign's share of budget changed this quarter.
Sources
How we researched this guide
We asked ChatGPT and Perplexity the questions founders actually ask on this topic, reviewed the pages those engines cite, and checked every figure above against its original source. Numbers we could not verify were left out. The method sections come from how we run dtc growth work on live Shopify accounts; client names and client numbers are never published without permission. Last reviewed .

Co-Founder, CRO and Landing Pages, Succession Media
CRO and landing-page architect for 7 and 8-figure DTC brands. Runs the strategy call, the funnel teardown, and the weekly testing loop that turns spend into profit.
Related guides
- DTC GrowthWhy has my DTC brand plateaued, and how do I break through?
- Creative and Meta AdsWhat is a good ROAS for a supplement brand on Meta, and how do you calculate break-even ROAS?
- Creative and Meta AdsHow often should you refresh Meta ad creatives, and how many should you test per week?
- Shopify CROWhy Did My Shopify Conversion Rate Suddenly Drop? A Step-by-Step Diagnosis